
In today’s fast-paced digital landscape, businesses are increasingly reliant on technology to drive their operations and deliver exceptional user experiences. As technology becomes the backbone of modern enterprises, the need for robust and efficient IT infrastructure management has become paramount. At the heart of this management lies monitoring — an indispensable practice that ensures the seamless functioning and optimal performance of an organization’s digital ecosystem.
Monitoring refers to the systematic and continuous observation of various components and processes within an IT infrastructure. It involves the collection, analysis, and interpretation of data related to hardware, software, networks, applications, and services, providing real-time insights into their performance, availability, and security. By actively monitoring their systems, organizations can proactively identify and address potential issues, prevent downtime, enhance performance, and maintain a secure environment.
For businesses of any size, effective monitoring holds immense importance and offers a multitude of benefits, particularly in the interconnected world of modern IT infrastructure. Coming from a System Operation background, monitoring is critical for the operation of any infrastructure. Monitoring is also essential from a security or a governance’s perspective. Let’s dive in and explore Azure Monitoring in simple terms.
So what is Azure Monitoring and what does Azure Monitoring offer?
Azure Monitor is a powerful monitoring solution that helps you gather, analyze, and take action based on the data collected from your cloud and on-premises environments. Its main goal is to enhance the availability and performance of your applications and services.
With Azure Monitor, you can collect data from various components of your system and consolidate it within a central platform. This platform enables you to analyze and correlate data across multiple Azure subscriptions, tenants, and other services. Having all your data in one place allows you to utilize common tools for analysis and visualization.
One of the key features is the ability to create customized dashboards using metrics collected from Azure Monitor. These dashboards provide a visual representation of your system’s performance and help you monitor crucial metrics at a glance. Moreover, by gaining insights into your application’s performance, you can proactively respond to system events and initiate necessary actions.
For instance, you can leverage Azure Monitor’s alerting capability to set up rules that trigger an Azure Function. This enables the execution of recovery actions when Azure Monitor detects service degradation or specific alert conditions are met. This automated response helps ensure the smooth functioning and availability of your services.
Additionally, Azure Monitor includes Azure Monitor SCOM Managed Instance, which lets you migrate your existing on-premises System Center Operations Manager (Operations Manager) installation to Azure, providing a seamless monitoring experience.
You can use Azure Monitor to monitor these types of resources in Azure, other clouds, or on-premises:
- Applications
- Virtual machines
- Guest operating systems
- Containers including Prometheus metrics
- Databases
- Security events in combination with Azure Sentinel
- Networking events and health in combination with Network Watcher
- Custom sources that use the APIs to get data into Azure Monitor
You can also export monitoring data from Azure Monitor into other systems to use the data on third party monitoring or visualization solutions, or to integrate the data with ticketing and other IT Service Management systems.
The following diagram is taken from Microsoft and gives a high level overview of Azure Monitor.
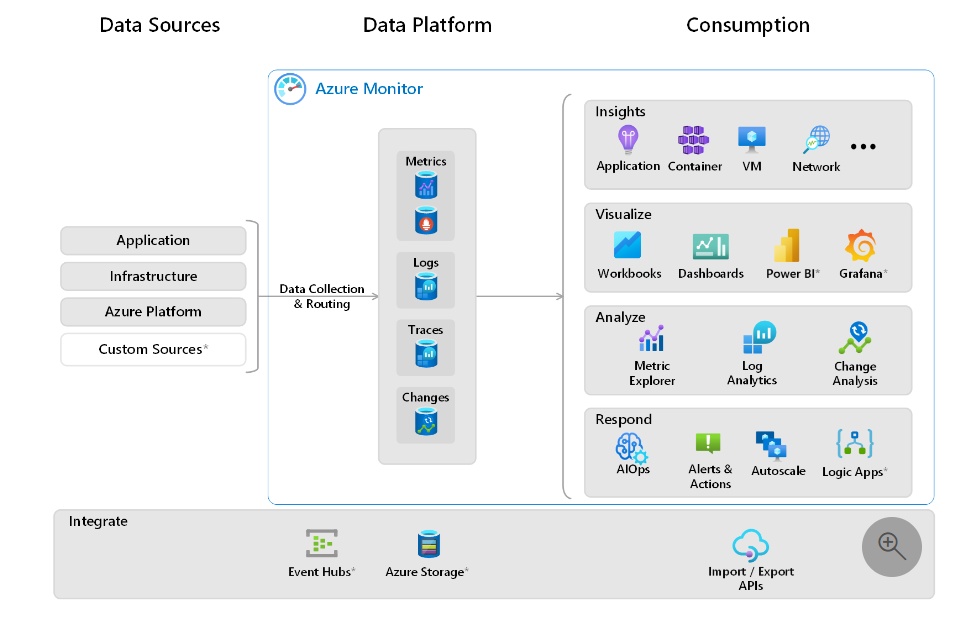
There are three components in the Azure Monitor system, namely, Data Sources, Data Platform and Consumption.
Data Source
Azure Monitor gathers information from various places, such as your application, operating systems, the services it depends on, and the Azure platform itself. This allows you to get a comprehensive view of what’s happening in your system. The table below is from Microsoft, illustrates the different types of data sources that Azure Monitor collects.

Data Platform
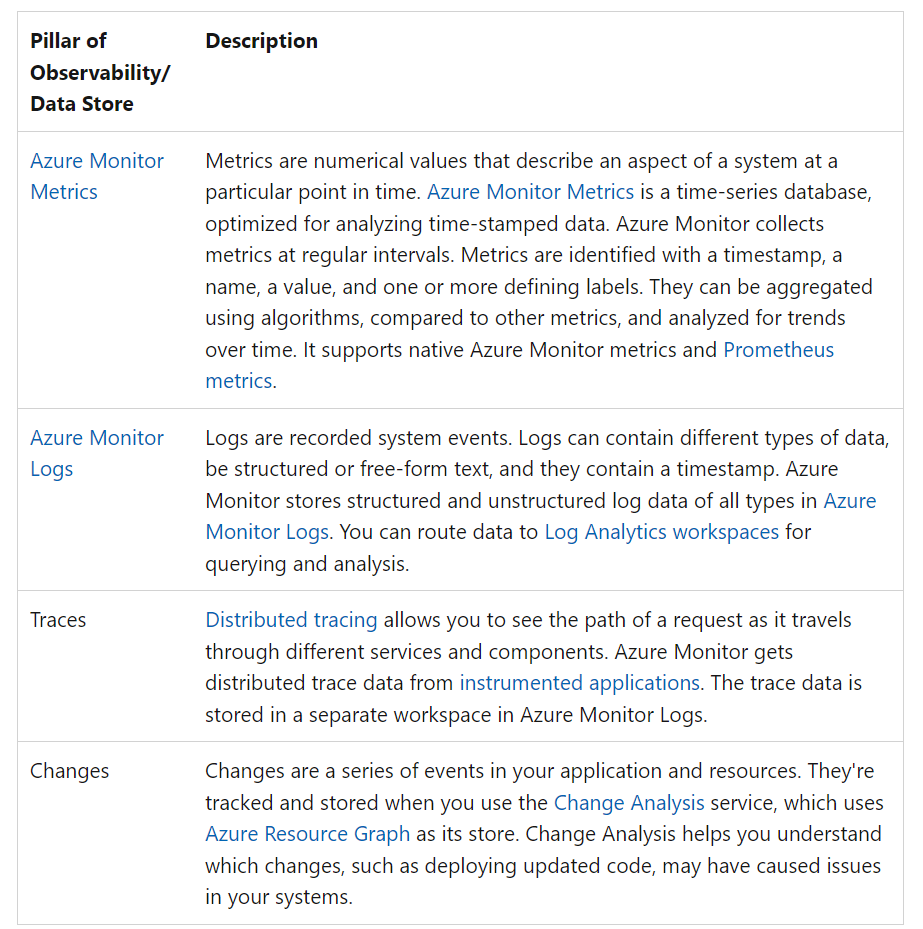
Azure Monitor keeps track of different types of information using specialized data stores. These stores are designed for metrics (performance data), logs (records of events), distributed traces (tracking requests across multiple services), and changes (modifications in the system). Each store is optimized for specific monitoring needs.
Distributed tracing is a technique that helps you trace the path of a request as it moves through various parts of a system. It allows you to see how the request moves through different services and components, which is useful for finding performance issues and solving problems in a distributed system.
If you need to keep monitoring data for a long time for auditing or compliance purposes without spending too much, you can export it to Azure Storage, which provides cost-effective long-term storage.
The table below from Microsoft outlines each of the Data store available.
Azure Monitor gathers and sends monitoring data using various methods based on the type of data and where it needs to go. Since Azure Monitoring solution was built over time, depending on the services, it may use a different mechanism to route and collect data to its destination.
- Application Instrumentation: Let’s say you have a web application running on Azure. By instrumenting your application code using Azure Monitor libraries, you can track specific metrics like response times, error rates, and user interactions. This data is then sent directly to Azure Monitor for analysis and monitoring.
- Agents: Imagine you have a fleet of virtual machines (VMs) running in Azure. You can install the Azure Monitor agent on each VM, which will collect performance metrics, log data, and other relevant information from the VMs. The agent then sends this data to Azure Monitor, providing you with insights into the health and performance of your VMs.
- Data Collection Rules: Suppose you have a database hosted in Azure SQL Database. With Azure Monitor, you can define a data collection rule specifying the specific metrics you want to collect, such as CPU usage, storage capacity, or query performance. Azure Monitor then regularly collects this data according to your defined rule and stores it for analysis.
- Internal Data Sources: Azure Monitor integrates with various Azure services, such as Azure App Service, Azure Functions, and Azure Storage. For example, if you have an Azure App Service hosting your web application, Azure Monitor automatically collects performance metrics, request logs, and error traces from the App Service to provide insights into your application’s behavior.
- Diagnostic Settings: Let’s consider an Azure virtual machine (VM) that is hosting your application. By configuring diagnostic settings for that VM, you can specify which types of logs and metrics to collect, such as OS logs, application logs, or network metrics. These logs and metrics are then sent to Azure Monitor for storage, analysis, and visualization.
- Azure Monitor REST API: The Azure Monitor REST API allows you to programmatically interact with Azure Monitor. You can use this API to send custom monitoring data from your applications or systems, retrieve specific metrics or logs, create or manage alert rules, and perform other monitoring-related tasks programmatically.
Some organizations prefer to send their monitoring data to non-Microsoft tools, and they can do so by using Azure Event Hubs. Azure Event Hubs is a platform that can receive and process streaming data. It can also transform and store the data to work with various real-time analytics providers or storage systems. By using Event Hubs, you can stream Azure Monitor data to external security information and event management (SIEM) tools or other monitoring solutions offered by partners.
Consumption
In the context of Azure Monitoring, “consumption” refers to how you utilize and interact with the monitoring data collected and stored within the Azure Monitor platform. It encompasses the various ways you can access, analyze, and make use of the data to gain insights, monitor performance, and take proactive actions.
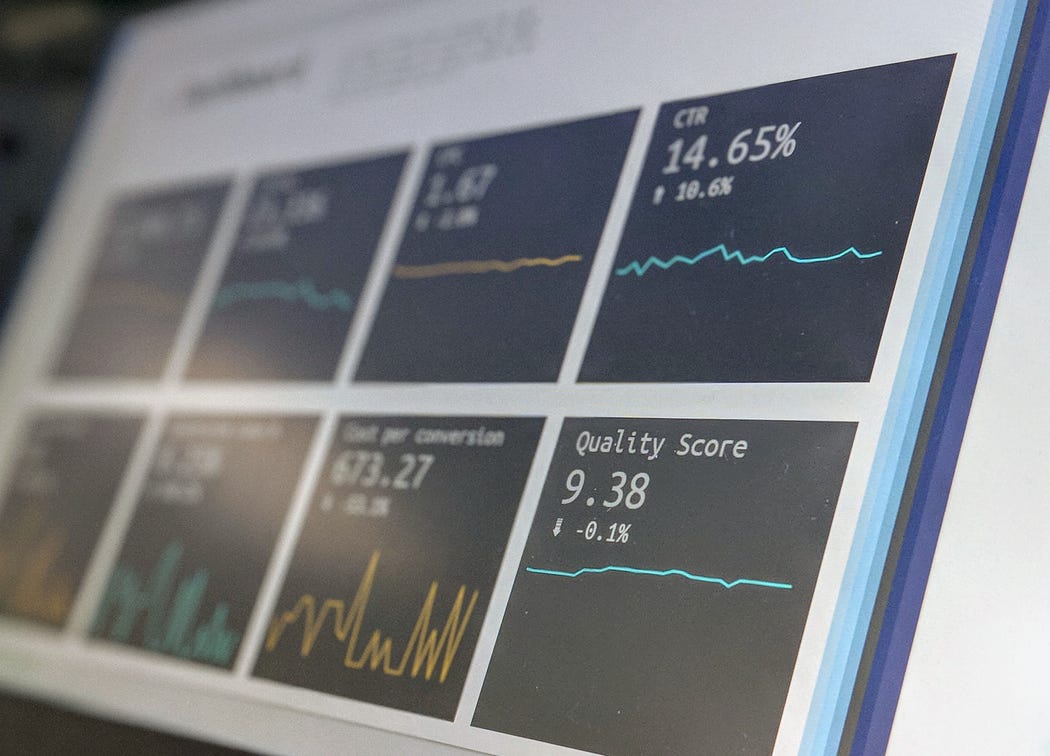
Visualize — With Azure Monitor, you can create visual representations of your data, making it easier to understand and monitor. For example, you can create a dashboard that shows the performance metrics of your web application, such as response times and error rates. By visually tracking these metrics, you can quickly identify any issues and take necessary actions to improve the application’s performance.
Think of Azure Monitor’s visualization feature as a way to display monitoring information, much like the traditional setup you would find in a Network Operations Center (NOC). In a NOC, you have multiple large monitors that show different dashboards. These dashboards provide real-time updates and insights about the infrastructure being monitored. Similarly, with Azure Monitor, you can create your own customized dashboards that show important metrics and visualizations. This gives you a centralized view of your applications, systems, and services, allowing you to easily keep track of their health and performance. It’s like having your own mini NOC, right at your fingertips.
Analyze: Azure Monitor provides tools to analyze the collected data and gain insights. For instance, you can use the Metrics Explorer to analyze the performance of your virtual machines over time. By examining the metrics, such as CPU usage or memory utilization, you can identify any patterns or anomalies that may indicate performance bottlenecks. This analysis helps you optimize resource usage and ensure smooth operation.
The “analyze” aspect of Azure Monitor is used in real-world settings to gain insights and make informed decisions. It helps optimize performance by identifying and resolving bottlenecks in applications. It aids in troubleshooting issues by analyzing metrics and logs to find the root cause. It assists in capacity planning by predicting resource needs based on utilization trends. It also helps ensure compliance and security by detecting anomalies and unauthorized activities. Overall, Azure Monitor’s “analyze” capability enables organizations to use monitoring data effectively for better performance, issue resolution, resource planning, and security compliance.
Respond: Azure Monitor allows you to set up alerts based on specific conditions. When an alert is triggered, you can respond promptly to address the issue. For example, you can create an alert that notifies you when the number of failed requests in your application exceeds a certain threshold. When the alert is triggered, you can investigate the cause and take corrective actions, such as scaling up the resources or debugging the code.
When analyzing the monitoring data, if an issue or anomaly is detected, Azure Monitor can be configured to initiate automatic responses. For example, if a service is failing, Azure Monitor can trigger an automated recovery process to restart or restore the service to a healthy state. Similarly, when a high traffic alert is detected, Azure Monitor can initiate auto-scaling actions to dynamically adjust the resources and ensure the application can handle the increased load.
Similarly, we can configure an alert rule and specify the conditions for detecting the anomaly and define the actions to be taken when the alert is triggered. One of the actions can be to send a notification to a specific person or team, informing them about the issue. This notification can be sent via email or SMS, ensuring that the relevant individuals are promptly notified and can investigate the issue further. This proactive alerting mechanism helps streamline the incident response process and ensures that the appropriate team members are promptly informed when anomalies occur.
Reference
https://learn.microsoft.com/en-us/azure/azure-monitor/overview
